You may hear El Niño, La Niña, ENSO, and now even “Super El Niño” used in the same news cycle. They are related, but they do not mean the same thing.
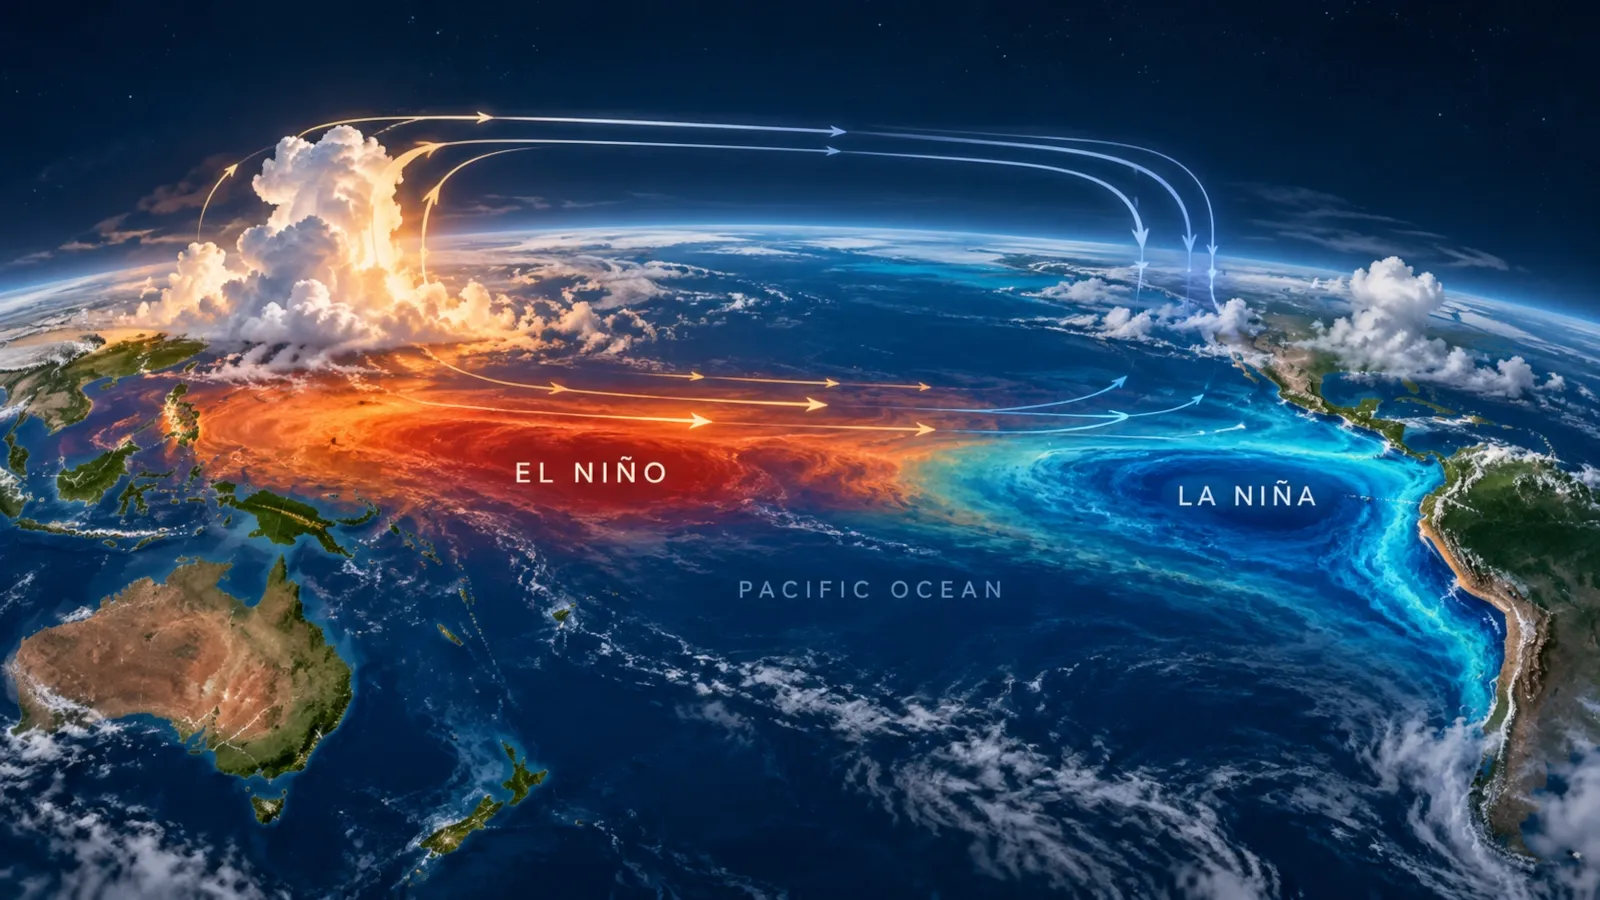
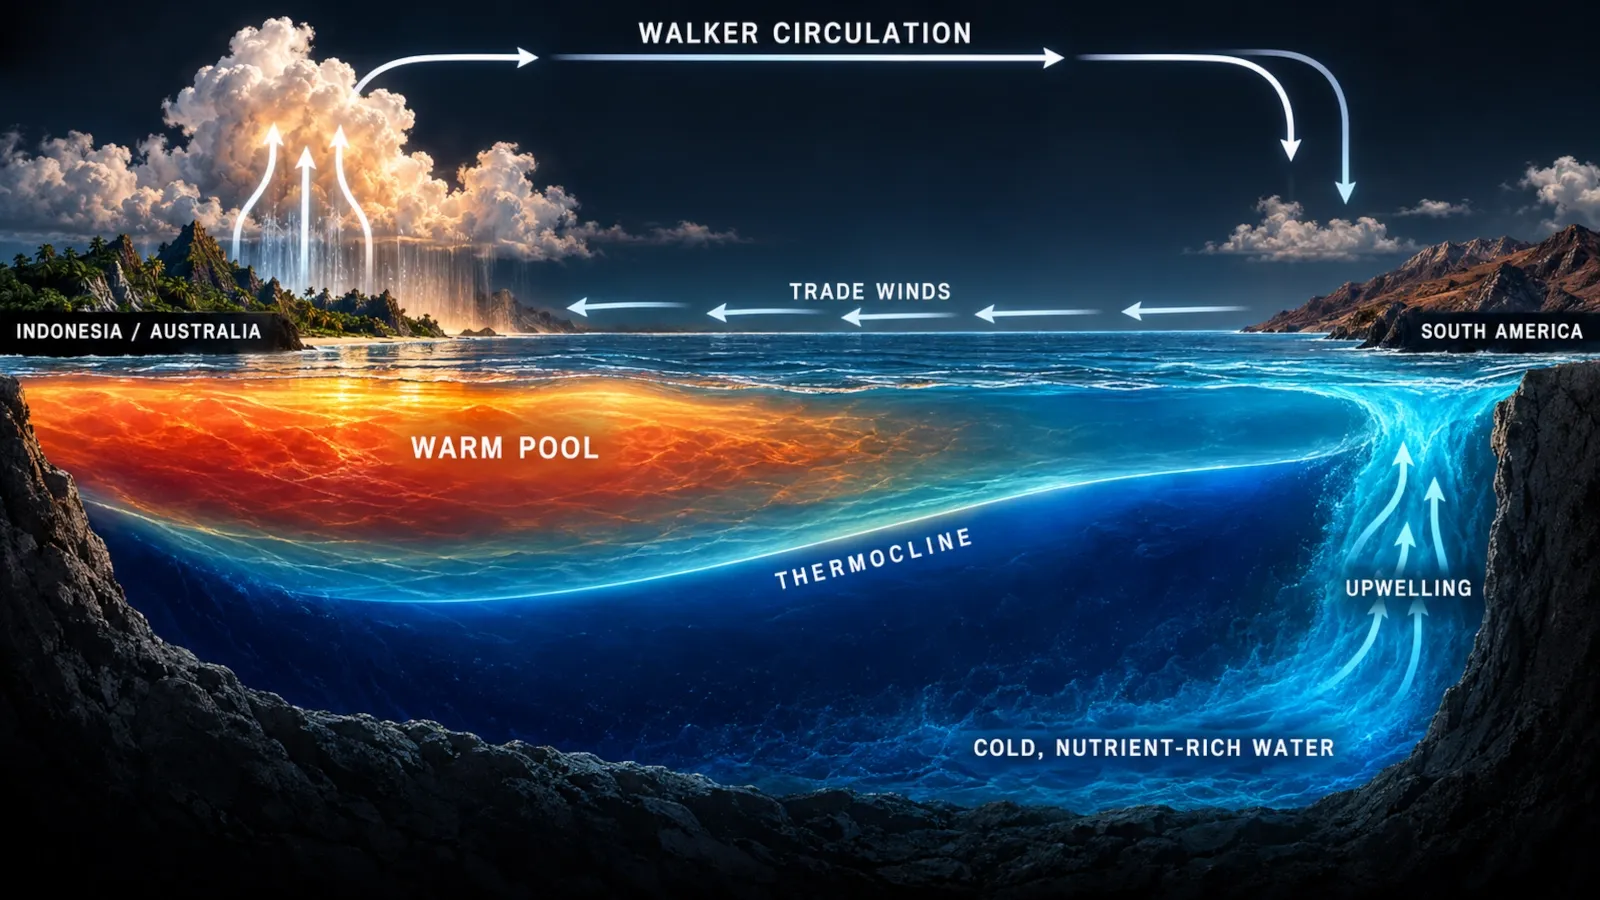
The simplest way to understand them is to start in the tropical Pacific Ocean. Under normal conditions, steady easterly trade winds push warm surface water westward toward Indonesia and the western Pacific. Cooler, nutrient-rich water rises near the west coast of South America. El Niño begins when this ocean–atmosphere pattern weakens and warm water spreads eastward. La Niña strengthens much of the normal pattern instead.
That shift may look small on a map, but the tropical Pacific is enormous. Move the warmest water, the heaviest tropical rainfall and the strongest rising air, and the atmosphere responds thousands of kilometres away. Jet streams move. Storm tracks change. Some regions become more likely to experience drought; others, heavy rain. Fisheries, agriculture, wildfire risk, tropical cyclones and even global average temperature can be affected.
This guide explains the full system — not just the headline.
Quick answer
El Niño is the warm phase of the El Niño–Southern Oscillation (ENSO), a naturally recurring interaction between the tropical Pacific Ocean and the atmosphere. During El Niño, sea-surface temperatures in the central and eastern equatorial Pacific become warmer than average, the easterly trade winds usually weaken, tropical rainfall shifts eastward and atmospheric circulation changes can alter seasonal weather patterns around the world.
La Niña is the cool phase. Trade winds are usually stronger, upwelling in the eastern Pacific strengthens and the central/eastern tropical Pacific becomes cooler than average.
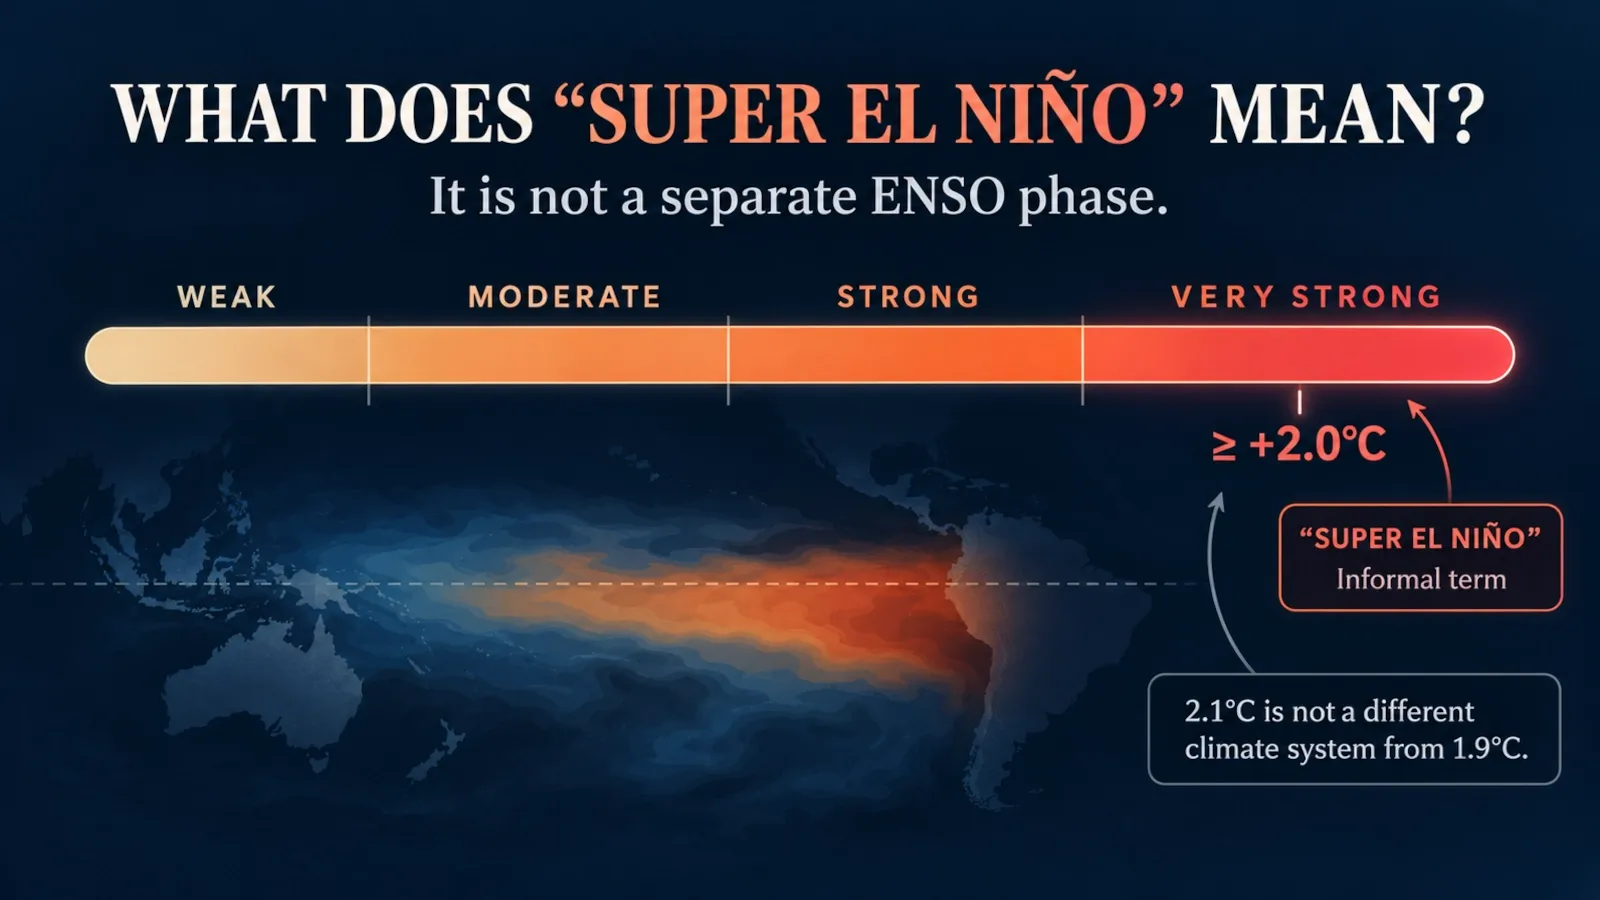
“Super El Niño” is not a separate ENSO phase. It is an informal label often used for an exceptionally strong El Niño. NOAA’s operational products instead classify ENSO strength using categories such as weak, moderate, strong and very strong.
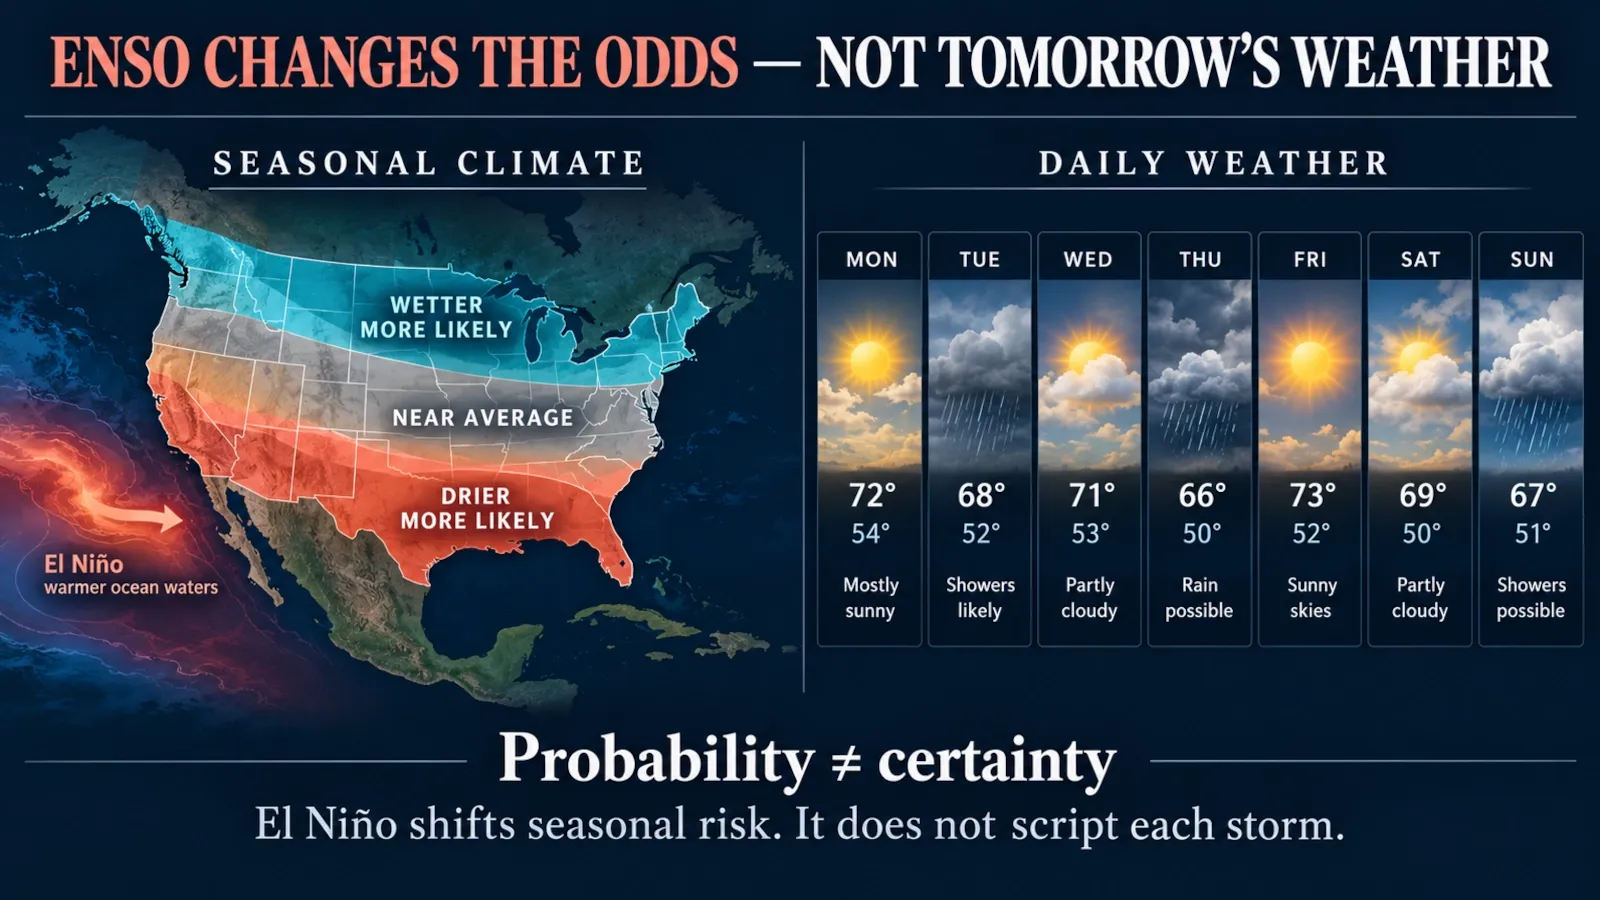
Most importantly, ENSO changes probabilities, not certainties. El Niño does not tell you whether it will rain in your city tomorrow. It changes the odds of seasonal patterns over large regions.
When to use this explanation
Use this guide if you want to understand any of these questions:
- What is El Niño in simple terms?
- What is the difference between El Niño and La Niña?
- What causes El Niño?
- What is a “Super El Niño”?
- How does El Niño change rain, snow, heat and hurricanes?
- Which parts of the world are most affected?
- How do scientists measure and forecast ENSO?
- Does climate change make El Niño stronger?
- How long does El Niño last?
- What is happening during the 2026–2027 El Niño?
If you only need today’s local weather forecast, an ENSO explainer is not the right tool. Use your national meteorological service or local weather authority instead. ENSO is mainly useful for understanding seasonal climate risk, not day-to-day weather.
Before you start
Three ideas prevent most misunderstandings about ENSO:
- Weather is not climate. A wet El Niño winter does not mean every day will be rainy.
- Typical does not mean guaranteed. Two El Niño events of similar oceanic strength can produce different regional impacts.
- A strong El Niño does not make every effect stronger everywhere. Event location, timing, other ocean basins and atmospheric variability all matter.
The current-outlook section in this article is time-sensitive. It was reviewed on 16 October 2026 and should be checked against the latest NOAA and WMO updates whenever the article is revised.
El Niño, La Niña and ENSO in one minute
ENSO stands for El Niño–Southern Oscillation. It describes a coupled ocean–atmosphere cycle in the tropical Pacific with three broad states: El Niño, neutral and La Niña.
| Feature | El Niño | ENSO-neutral | La Niña |
|---|---|---|---|
| Central/eastern equatorial Pacific | Warmer than average | Near average | Cooler than average |
| Trade winds | Usually weaker | Near normal | Usually stronger |
| Eastern-Pacific upwelling | Reduced | Near normal | Enhanced |
| Warm surface water | Extends farther east | Concentrated mostly west | Pushed more strongly west |
| Tropical rainfall | Shifts toward central/eastern Pacific | Closer to average pattern | Concentrates more over western Pacific/Indonesia |
| Walker circulation | Weaker/reorganised | Near average | Stronger |
| Global mean temperature tendency | Often temporarily warmer | No strong ENSO push | Often temporarily cooler than during El Niño |
| Atlantic hurricane tendency | Often less favourable | ENSO influence weaker | Often more favourable |
| Central/eastern Pacific hurricane tendency | Often more favourable | ENSO influence weaker | Often less favourable |
These are typical large-scale tendencies, not promises for any individual country, season or storm.
Main explanation: how ENSO works step by step
1. Start with the normal tropical Pacific
To understand El Niño, first picture the Pacific before El Niño begins.
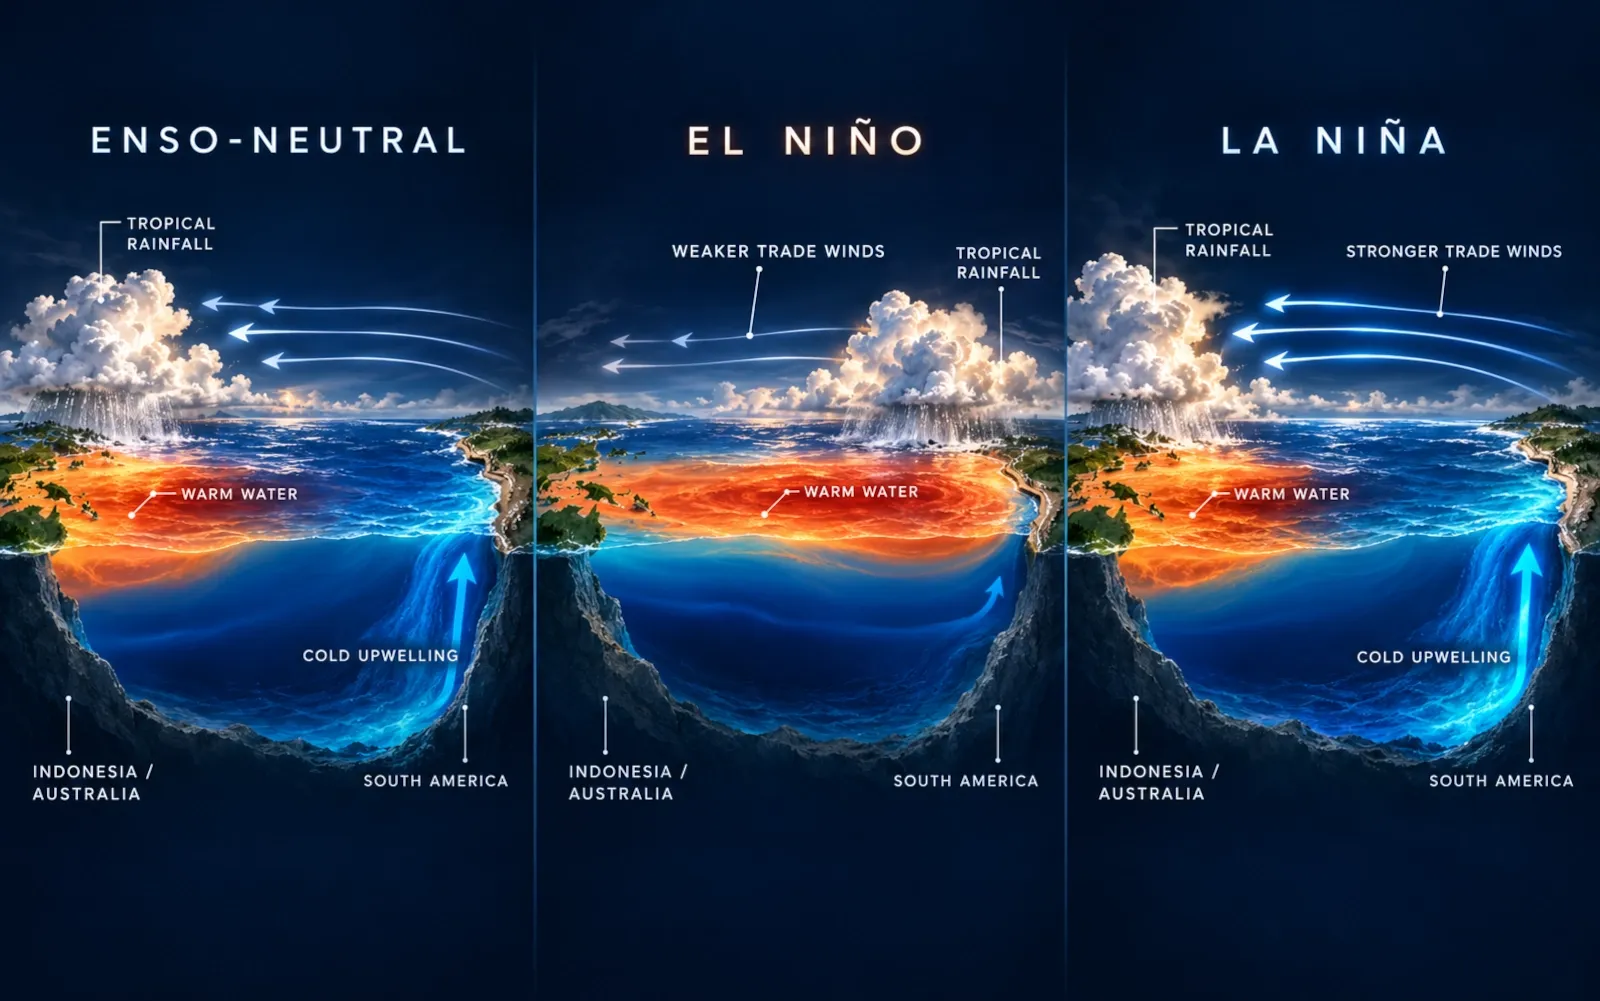
Near the equator, the prevailing trade winds generally blow from east to west. These winds help push warm surface water toward the western Pacific, where the ocean is normally warmer and the atmosphere tends to be humid and stormy.
Near Peru and Ecuador, surface water is displaced westward. Colder water rises from below to replace it. This process is called upwelling.
Upwelling matters for two reasons.
First, the colder eastern Pacific helps maintain the east–west temperature contrast across the basin. Second, deep water carries nutrients toward the surface, supporting one of the world’s most productive marine ecosystems.
The ocean and atmosphere reinforce each other. Warm water favours rising moist air and thunderstorms. Cooler water favours drier, sinking air. The large east–west atmospheric circulation tied to this contrast is called the Walker circulation.
So the normal tropical Pacific is not just an ocean current and not just a wind pattern. It is a coupled system.
2. El Niño begins when the coupled pattern weakens
During El Niño, the trade winds weaken over part of the equatorial Pacific and can sometimes temporarily reverse.
When the winds stop pushing warm surface water westward as effectively, warm water can spread back toward the central and eastern Pacific. The thermocline — the boundary between warmer surface water and colder deeper water — deepens in the east, reducing the amount of cold water that reaches the surface.
That makes the eastern and central tropical Pacific warmer.
But the key change is not temperature alone.
Warm tropical ocean water supplies heat and moisture to the atmosphere. As the warmest water shifts eastward, the main zone of tropical thunderstorms and rising air shifts as well. That relocation changes atmospheric pressure and circulation.
The result is a positive feedback:
weaker winds → warmer eastern/central Pacific → shifted tropical rainfall → atmospheric circulation changes → winds can weaken further.
This is why scientists describe ENSO as a coupled ocean–atmosphere phenomenon.
There is not always one single trigger. Shorter-lived atmospheric disturbances — including westerly wind bursts and phases of the Madden–Julian Oscillation — can contribute to the transition, but ENSO develops from the interaction of the entire tropical Pacific system rather than from one simple switch.
3. La Niña strengthens much of the normal pattern
La Niña is not simply “bad El Niño in reverse”, but its Pacific-ocean physics often pushes in the opposite direction.
During La Niña:
- easterly trade winds are generally stronger;
- warm surface water is pushed farther west;
- the thermocline becomes shallower in the eastern Pacific;
- cold, nutrient-rich upwelling strengthens;
- the central and eastern equatorial Pacific become cooler than average;
- tropical rainfall tends to shift west toward Indonesia and the western Pacific;
- the Walker circulation strengthens.
Because the atmosphere responds to a different pattern of tropical heating, La Niña produces its own network of global teleconnections.
4. The atmosphere carries the signal far beyond the Pacific
Why should ocean temperature near the equator affect rain or temperature thousands of kilometres away?
Because the tropical atmosphere is one connected fluid system.
When the main zone of tropical thunderstorms moves, it changes where enormous amounts of water vapour condense and release latent heat. That heating acts like a large disturbance in the atmosphere. It generates planetary-scale waves that alter circulation far from the tropics.
These long-distance links are called teleconnections.
One of their most visible effects is a change in the position and shape of the jet streams — fast rivers of air high in the atmosphere that help steer storms and separate air masses.
That is how an ocean–atmosphere change in the equatorial Pacific can influence winter rainfall in the southern United States, drought risk in parts of Australia or Indonesia, rainfall in eastern Africa, tropical cyclone environments and temperature patterns far from the Pacific.
5. ENSO changes the odds — it does not script the weather
This is the most important forecasting rule in the article:
El Niño and La Niña are probability shifters, not weather scripts.
A strong El Niño may increase the probability of a wet winter in one region, but individual storms still depend on shorter-timescale weather systems. A region can experience an El Niño season without displaying the textbook pattern every week or even every month.
Other influences can reinforce or oppose ENSO, including:
- the Indian Ocean Dipole;
- Atlantic sea-surface temperatures;
- the Madden–Julian Oscillation;
- stratospheric variability;
- land-surface conditions;
- sea ice;
- random atmospheric variability.
This is why “El Niño = rain” or “La Niña = drought” is never a sufficient explanation by itself.
What is La Niña?
La Niña is the cool phase of ENSO. NOAA identifies La Niña when the Niño-3.4 region of the equatorial Pacific is sufficiently cooler than average for a sustained period and the atmosphere shows a consistent La Niña response, such as stronger easterly trade winds and a westward concentration of tropical rainfall.
It is common to call La Niña the “opposite” of El Niño, and that is useful as a first approximation. But the real climate system is not perfectly symmetrical.
A La Niña of a given magnitude does not necessarily produce an equal-and-opposite version of the impacts from an El Niño of the same magnitude. Background climate conditions, event structure and interactions with other ocean basins can make the response asymmetric.
El Niño vs. La Niña: the differences at a glance
| Question | El Niño | La Niña |
|---|---|---|
| What happens to the tropical Pacific? | Central/eastern Pacific warms | Central/eastern Pacific cools |
| What happens to trade winds? | Usually weaken | Usually strengthen |
| What happens to upwelling near South America? | Usually weakens | Usually strengthens |
| Where is tropical convection focused? | Farther east than normal | Farther west than normal |
| Walker circulation | Weakens/reorganises | Strengthens |
| Atlantic hurricanes | Often suppressed by stronger vertical wind shear | Often favoured by weaker vertical wind shear |
| Eastern/central Pacific hurricanes | Often more favourable environment | Often less favourable environment |
| Global temperature | Often receives a temporary upward push | Often receives a temporary downward influence relative to El Niño years |
| Is every impact reversed? | No | No |
What is a “Super El Niño”?
“Super El Niño” sounds like a separate climate phenomenon. It is not.
The scientific core is still El Niño. The word super is an informal label commonly used in media and public discussion for an exceptionally strong event.
NOAA’s current ENSO products use explicit strength categories based on the Relative Oceanic Niño Index (RONI), including weak, moderate, strong and very strong. In that operational framework, values at or above +2.0°C in the Niño-3.4 region fall into the very strong category.
That does not mean the climate suddenly behaves differently at +2.0°C compared with +1.9°C. Strength categories are useful for communication and probabilistic forecasting, but the atmosphere is continuous, not divided by physical walls at round thresholds.
Is “Super El Niño” an official scientific category?
Not in the sense of being a separate ENSO phase.
You may see scientists use the phrase informally when discussing historically exceptional events, but operational agencies generally communicate with measurable indices and strength categories.
For ClearHowGuide, the safest interpretation is:
“Super El Niño” = an informal name for a very strong or exceptional El Niño, not a fourth ENSO state.
Does a stronger El Niño mean stronger impacts everywhere?
No.
NOAA explicitly warns that the strength of the Niño index does not guarantee the strength of impacts in any one region. Stronger events can make some textbook patterns more likely or increase confidence in broad seasonal signals, but they do not guarantee extreme rain, heat, drought or storms at a particular location.
This distinction is crucial whenever headlines describe a “Godzilla” or “Super” El Niño.
How scientists know an El Niño has started
Scientists do not declare El Niño from one warm patch of water or one unusual storm.
They look for a sustained, coupled ocean–atmosphere pattern.
The Niño-3.4 region
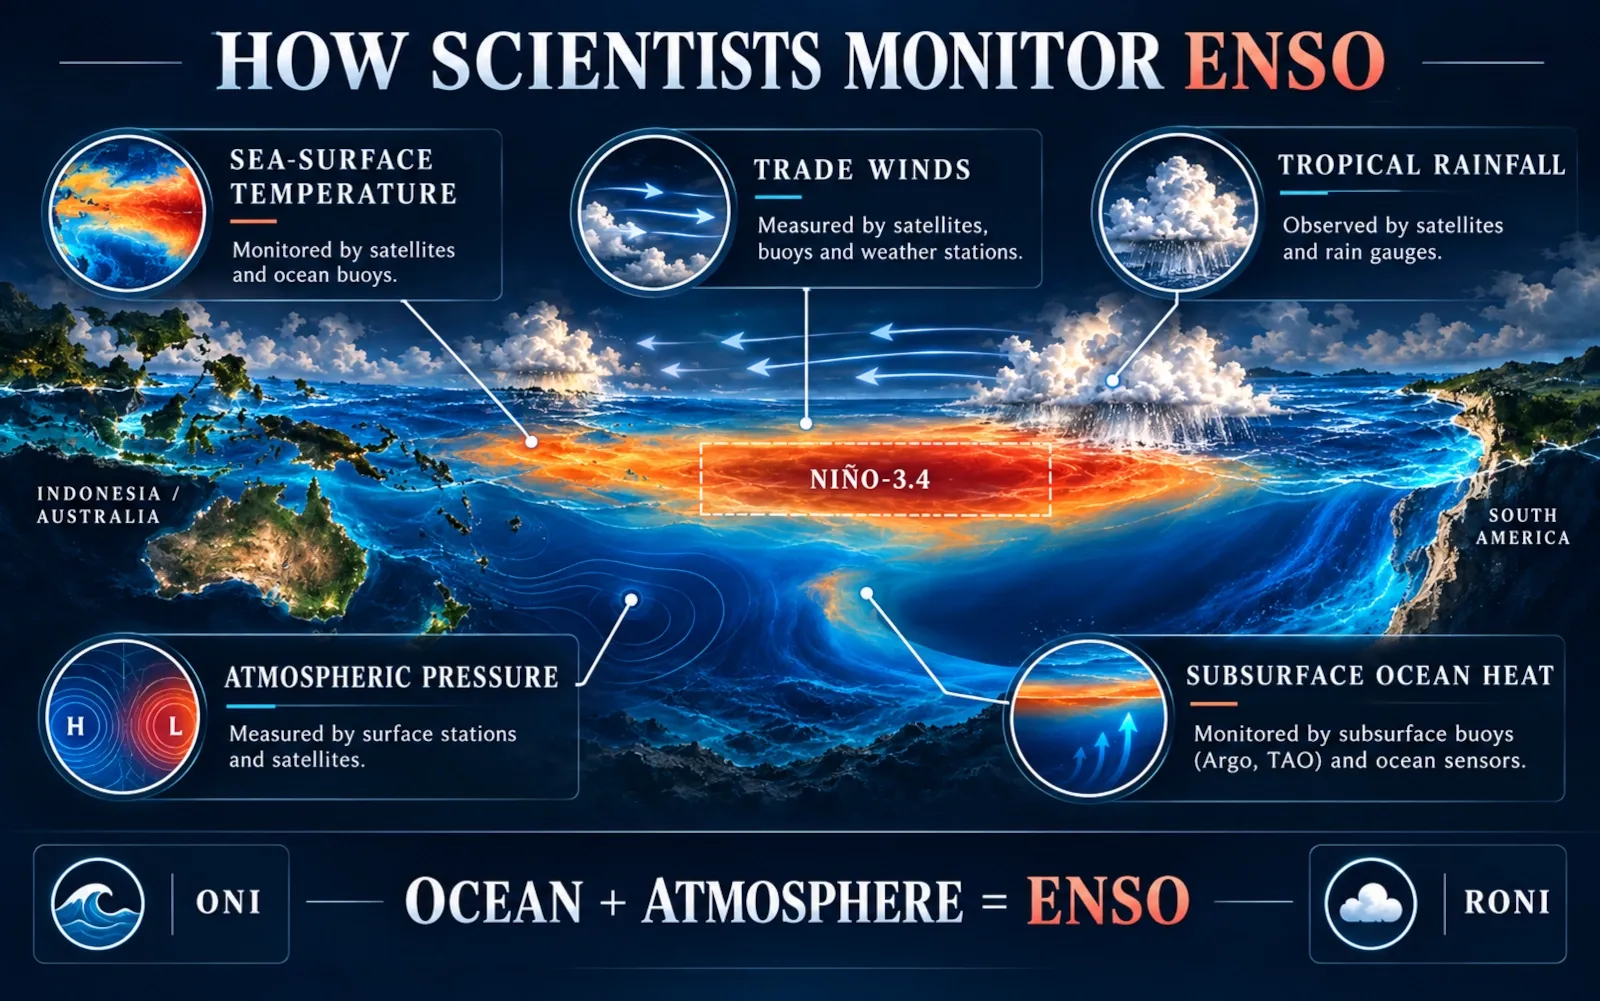
A central monitoring area is the Niño-3.4 region, located in the east-central equatorial Pacific.
NOAA’s El Niño criteria include:
- sea-surface temperatures in Niño-3.4 at least 0.5°C above average;
- persistence or expected persistence across several overlapping three-month periods;
- an atmospheric response consistent with El Niño.
Atmospheric signals can include weaker easterly trade winds, less rain over Indonesia and more convection in the central/eastern equatorial Pacific.
For La Niña, the temperature anomaly is at least 0.5°C below average, together with the corresponding atmospheric response.
Oceanic Niño Index and Relative Oceanic Niño Index
Historically, the Oceanic Niño Index (ONI) has been one of the best-known ENSO measures.
NOAA now also uses the Relative Oceanic Niño Index (RONI) in operational strength outlooks. RONI measures tropical Pacific temperature anomalies relative to the broader tropical-ocean background, helping account for a warming climate when classifying ENSO strength.
Different agencies and research groups can use different indices, baselines and averaging methods. That is why two legitimate ENSO products may quote different anomaly values without actually contradicting each other.
The Southern Oscillation
The “SO” in ENSO refers to the Southern Oscillation — a large-scale atmospheric pressure seesaw across the tropical Pacific.
A classic measure compares sea-level pressure near Tahiti and Darwin, Australia. El Niño tends to be associated with pressure patterns consistent with a weakened Walker circulation; La Niña tends toward the opposite.
The point is not to memorise every index. It is to understand that ENSO is both oceanic and atmospheric.
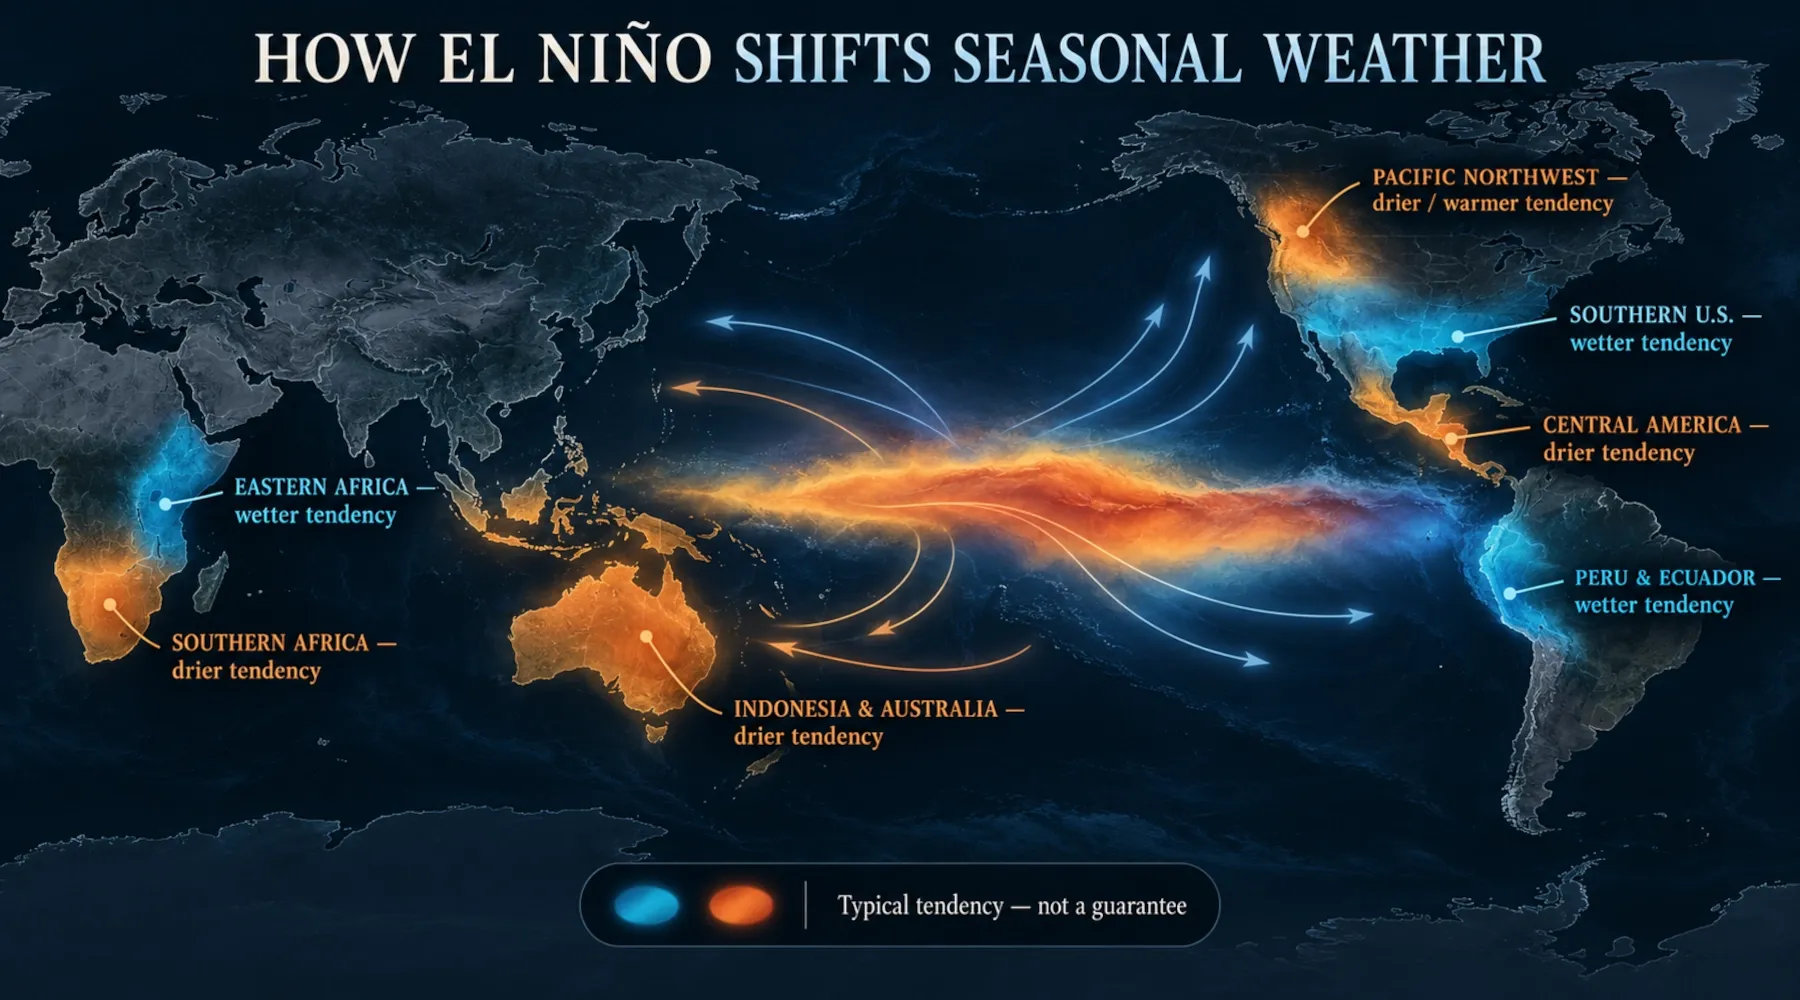
How El Niño changes weather around the world
El Niño changes the location of tropical heating and rainfall, and that can reshape circulation around the globe.
The exact pattern varies from event to event, but several broad relationships appear often enough to be useful for seasonal forecasting.
Western Pacific, Indonesia and Australia
El Niño often shifts tropical rainfall away from the far western Pacific.
Parts of Indonesia, the Philippines and Australia can become drier than usual, increasing the risk of:
- drought;
- water stress;
- agricultural losses;
- heat;
- vegetation and wildfire impacts.
Not every El Niño produces severe drought in every one of these locations, and local seasonal forecasts should always take priority over a generic ENSO map.
Peru, Ecuador and the eastern Pacific
The eastern tropical Pacific can become much warmer than usual.
Along parts of coastal Peru and Ecuador, El Niño can increase the probability of heavy rainfall and flooding. The weakened upwelling also changes marine productivity and fish distribution.
Historically, this region is where the term El Niño originated: Peruvian fishers noticed unusually warm coastal water appearing around Christmas, hence the Spanish name referring to “the boy” or Christ child.
North America
El Niño’s most reliable North American influence is usually during Northern Hemisphere winter.
A stronger subtropical jet can favour a wetter storm track across parts of the southern United States. The Pacific Northwest and parts of the northern tier often tilt drier or warmer than average.
However, the pattern is probabilistic. California, Texas, Florida or any other individual state can depart substantially from the canonical map in a given event.
Central America and northern South America
Parts of Central America and northern South America can experience increased drought risk during El Niño. That matters for:
- agriculture;
- hydropower;
- water supply;
- wildfire risk;
- river and canal operations.
The Panama Canal is a useful example of why ENSO can become a global economic issue. When rainfall and reservoir inflows are low, shipping restrictions can become necessary. ENSO is not the only factor controlling Panama’s rainfall, but it can be an important seasonal driver.
Eastern Africa
Parts of equatorial eastern Africa can tilt wetter during some El Niño seasons, raising the risk of flooding, especially when other climate drivers reinforce the signal.
Again, “wetter” is not automatically beneficial. Heavy rain after prolonged drought can damage crops, infrastructure and soils rather than simply reverse drought impacts.
Southern Africa and parts of South Asia
Some El Niño events are associated with increased drought risk in southern Africa and a weaker Indian monsoon. The strength and location of these relationships vary, and the Indian Ocean can substantially modify them.
Rain, snow, heat and hurricanes: the questions people actually ask
Does El Niño mean more rain?
Not everywhere.
El Niño redistributes rainfall.
Some regions become more likely to be wetter than average; others become more likely to be drier. Even within one country, impacts can differ sharply by region and season.
The useful question is not “Does El Niño cause rain?” but:
How does El Niño change the probability of rain in this region during this season?
Does El Niño mean more snow?
Sometimes, in some places.
A storm track that brings more moisture can increase snowfall if temperatures are cold enough. But El Niño can also make some regions warmer, turning potential snow into rain.
There is no global rule that El Niño means a snowier winter.
Does El Niño mean a hotter summer?
Not necessarily.
El Niño often raises global-average surface temperature because more heat is released from the tropical Pacific into the atmosphere, but regional seasonal temperature effects differ.
A warmer global mean does not mean every place experiences an unusually hot summer.
Which is colder: El Niño or La Niña?
At the scale of the tropical Pacific, La Niña is the cool phase and El Niño is the warm phase.
Globally, La Niña often produces a temporary cooling influence relative to El Niño by storing more heat below the ocean surface and strengthening cold upwelling. But long-term global warming continues underneath this natural year-to-year variability.
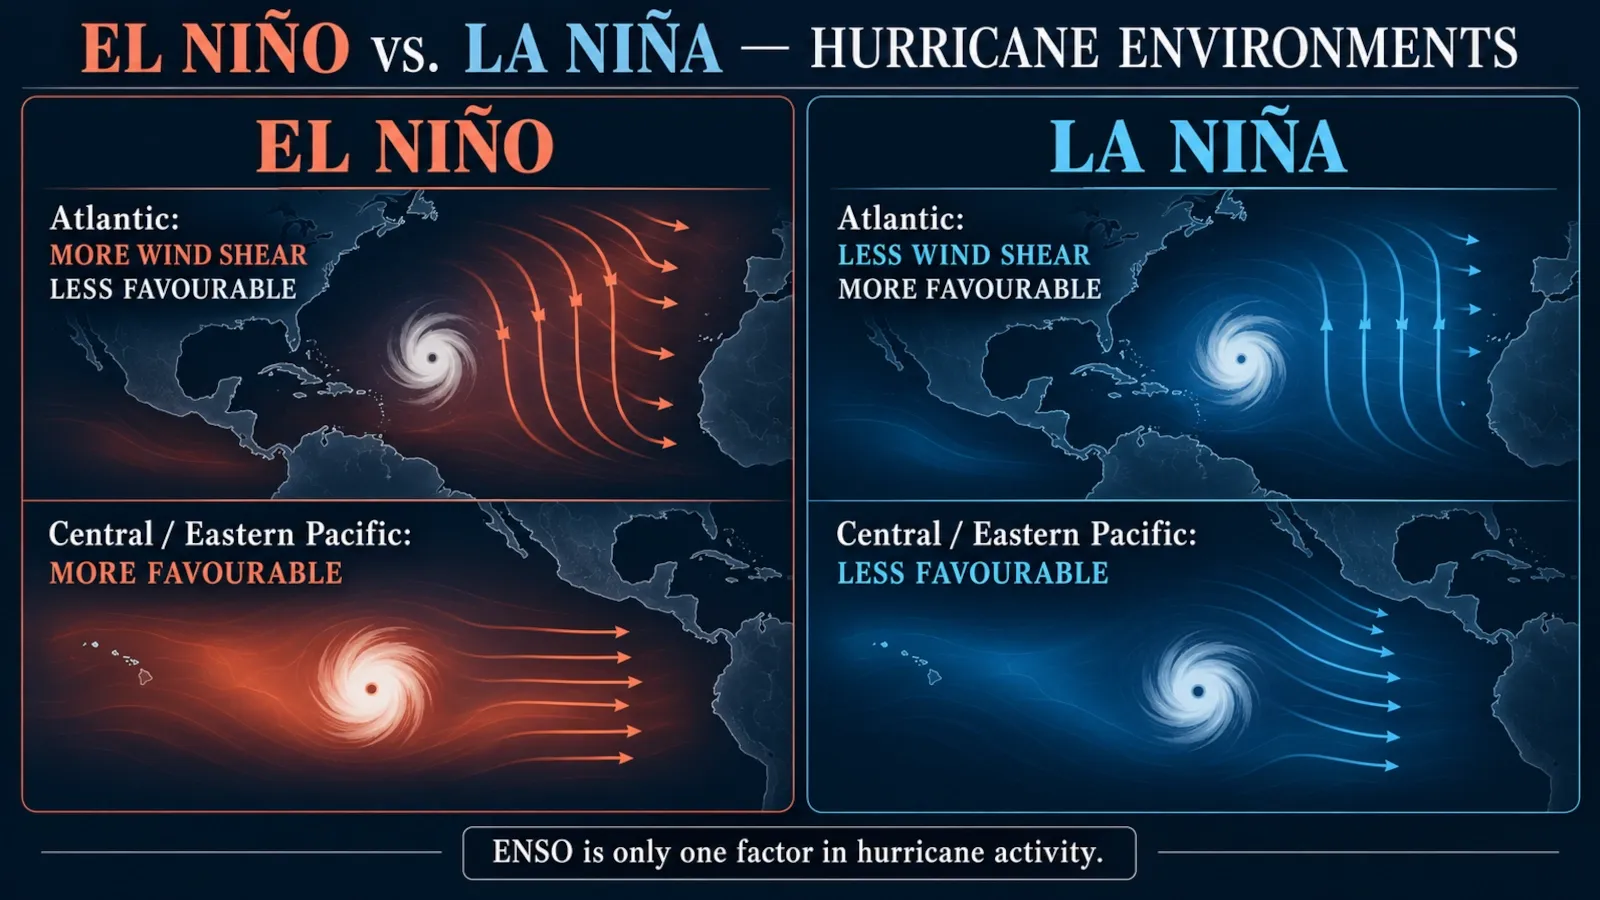
Which is worse for hurricanes: El Niño or La Niña?
It depends on the ocean basin.
During El Niño, stronger vertical wind shear over the tropical Atlantic often suppresses Atlantic hurricane activity. At the same time, atmospheric conditions in the central/eastern Pacific can become more favourable for tropical cyclones.
During La Niña, the pattern is often reversed: Atlantic wind shear tends to weaken, which can favour more hurricane activity, while the central/eastern Pacific becomes less favourable.
ENSO is only one hurricane-season driver. Atlantic ocean temperatures, African monsoon conditions, atmospheric moisture and other factors also matter.
How La Niña changes weather around the world
La Niña strengthens the normal tropical Pacific temperature contrast and shifts the main tropical rainfall zone westward.
Typical large-scale patterns include:
- wetter conditions over parts of Indonesia and the western equatorial Pacific;
- drier conditions near the eastern equatorial Pacific;
- increased rainfall in some parts of northern South America and southern Africa during Northern Hemisphere winter;
- drier conditions in equatorial eastern Africa during some seasons;
- a North American winter jet-stream pattern that often favours cooler/wetter conditions in the Pacific Northwest and warmer/drier conditions across parts of the southern United States;
- a more favourable environment for Atlantic hurricanes.
These are broad climatological relationships. La Niña does not simply reverse every El Niño impact point by point.
What El Niño does to oceans, wildlife and fisheries
ENSO is often discussed as a weather story, but its starting point is the ocean.
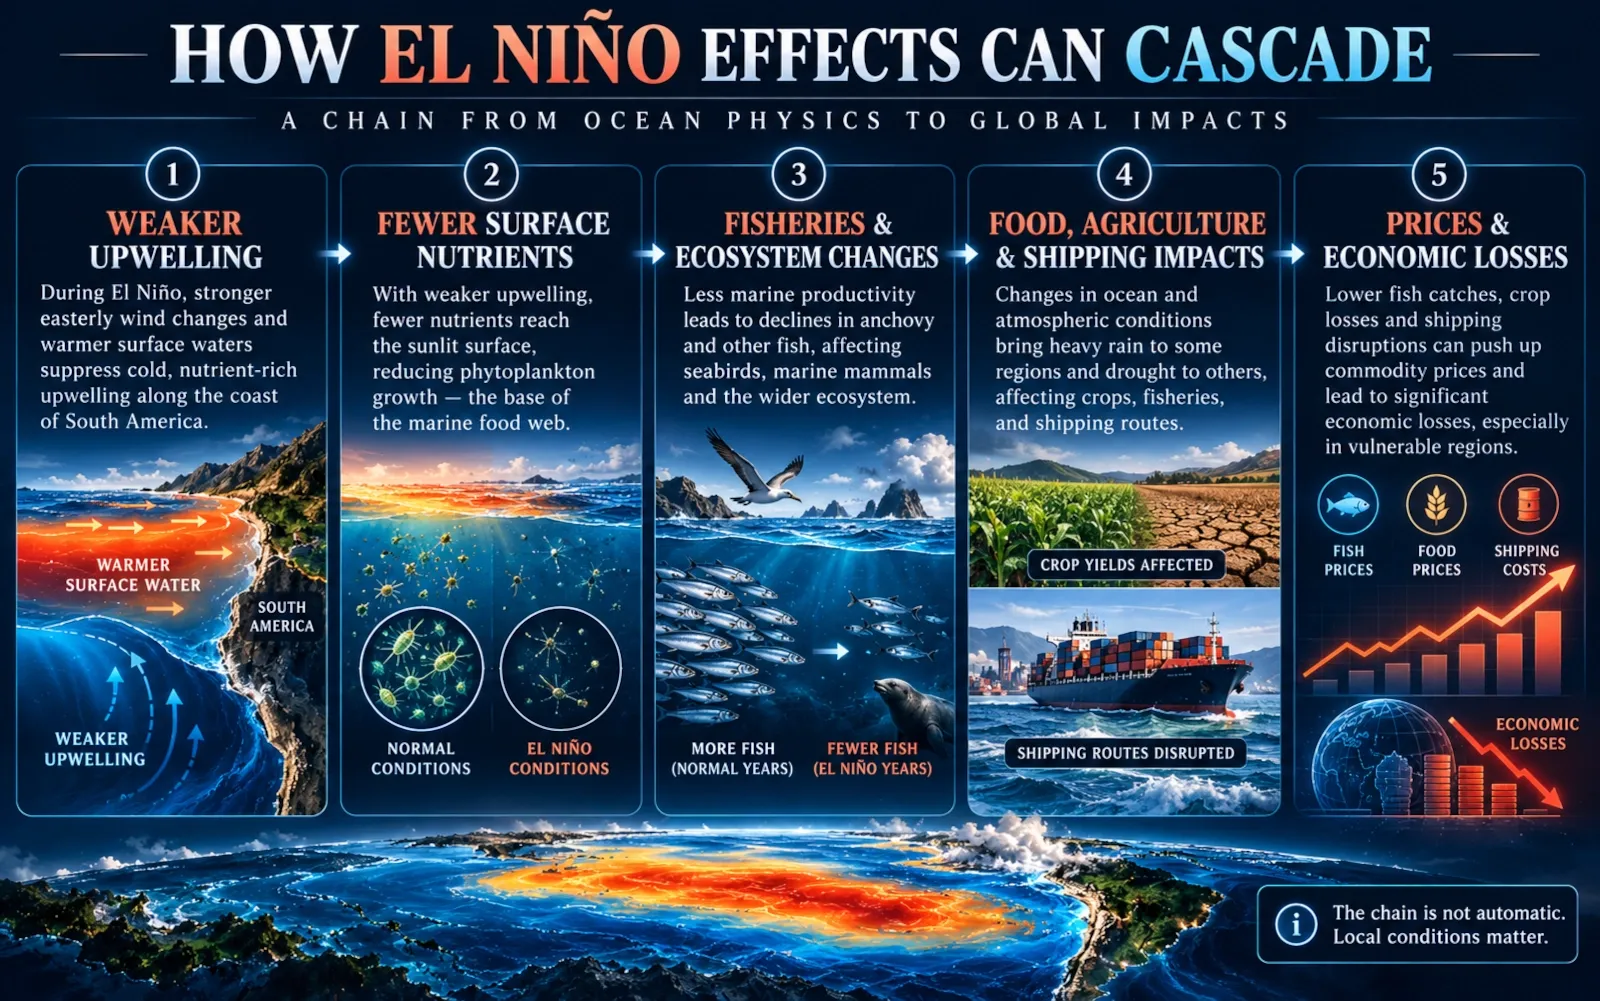
Upwelling and nutrients
Under normal conditions, upwelling near Peru and Ecuador brings cold, nutrient-rich deep water into the sunlit surface layer.
During El Niño, weaker trade winds and a deeper thermocline reduce this nutrient supply.
Less nutrient input can reduce phytoplankton productivity, which can cascade through the food web.
Fisheries
Species that depend on cool, nutrient-rich conditions may move deeper or shift geographically.
That can affect:
- anchovy and other fisheries;
- seabirds;
- marine mammals;
- predators that follow prey;
- fishing communities and export markets.
The exact biological response depends on event location, duration and ecosystem conditions.
Coral reefs and marine heat
El Niño can contribute to unusually warm ocean conditions and marine heat stress in some regions, increasing the risk of coral bleaching.
But bleaching cannot be attributed to ENSO alone. Long-term ocean warming has raised the baseline temperature on which natural variability operates.
How El Niño can affect food, prices and global trade
ENSO can become an economic story because weather connects directly to agriculture, water, energy, fisheries and transport.
Agriculture and food
If El Niño increases drought risk in a major crop-producing region, yields may fall. If it produces excessive rain or flooding, crops can also be damaged.
Important commodities can be affected through:
- coffee-growing regions in the tropics;
- grains;
- sugar;
- palm oil;
- cocoa;
- fisheries;
- livestock feed;
- regional food staples.
Price effects are not automatic. Inventories, trade policy, currency movements, energy prices and conditions in competing producing regions can amplify or offset the climate signal.
Shipping and infrastructure
Low rainfall can affect reservoirs and river transport. Excessive rain can damage roads, ports and rail networks.
The Panama Canal demonstrates how climate variability in one narrow geographic corridor can affect global logistics.
Economic losses can persist
A 2023 study in Nature Communications estimated that the economic effects of major El Niño events can persist for years, not merely during the months when sea-surface temperatures are anomalous.
The study estimated cumulative global income losses of roughly US$2.1 trillion for the 1997–98 event and US$3.9 trillion for 2015–16, using a statistical climate–economy model.
These numbers are model-based estimates of wider economic effects, not a simple total of insured disaster losses. They should therefore be interpreted as estimates with methodological assumptions, not as exact bills attributable to ENSO.
The strongest El Niño events in history
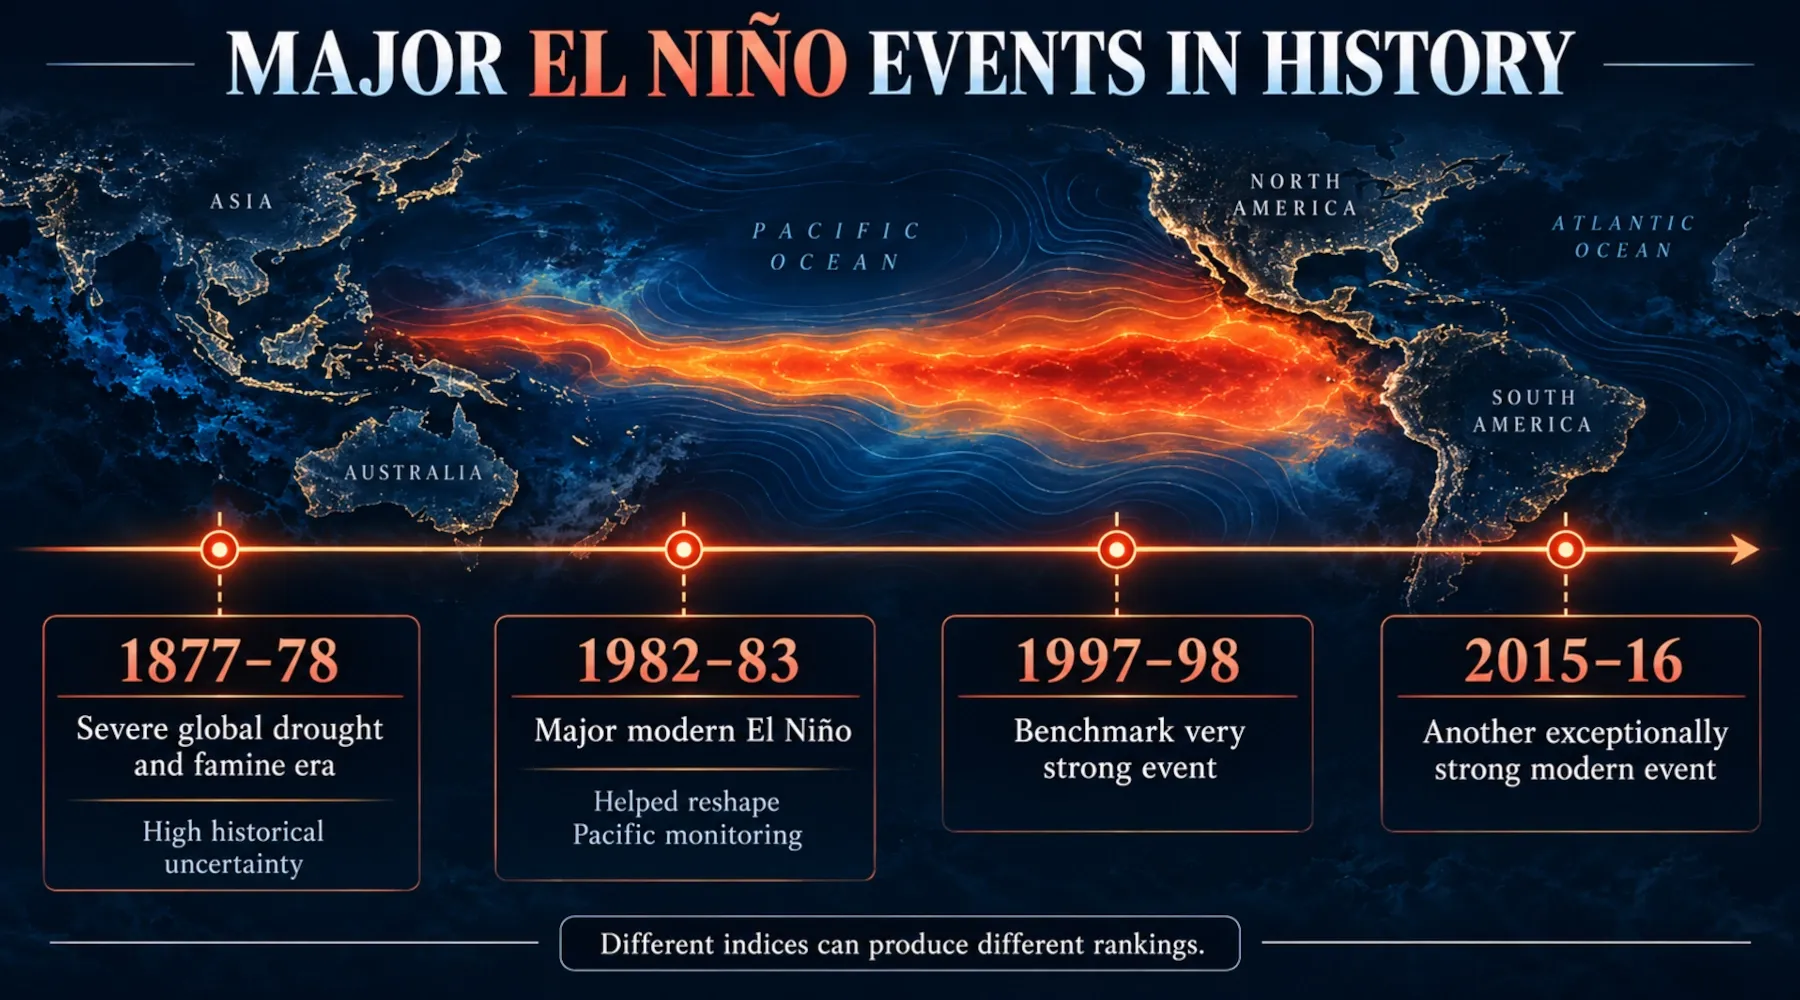
Ranking El Niño events is more complicated than putting one temperature number into a table.
Different indices measure different regions and aspects of ENSO, and older events have much larger observational uncertainty.
1982–83
The 1982–83 El Niño was one of the strongest events of the modern instrumental era.
It is also historically important because it surprised scientists. The event helped accelerate development of the modern tropical-Pacific observing system, including arrays of ocean buoys designed to monitor the ocean–atmosphere system in real time.
1997–98
The 1997–98 event became one of the benchmark strong El Niños.
It produced major climate disruptions in many regions and occurred during an era with much better satellite and ocean observations than 1982–83.
2015–16
The 2015–16 El Niño was another exceptionally strong modern event.
NOAA analyses have shown that 1982–83, 1997–98 and 2015–16 are difficult to separate into a simple universal ranking because the answer depends on the index used and the uncertainty in sea-surface temperature estimates.
1877–78
The 1877–78 event is often described as an extraordinary historical El Niño and has been associated with severe droughts and famine crises.
But data coverage in the nineteenth century was sparse. NOAA reconstructions can produce a very large peak anomaly, while ensemble analyses show much greater uncertainty than for modern events.
That means statements such as “1877 was definitely the strongest El Niño ever” should be treated cautiously.
Likewise, very large historical death tolls from nineteenth-century famines cannot be assigned to El Niño alone. Food systems, colonial policy, conflict, poverty, disease and governance all influenced mortality.
Does climate change make El Niño stronger?
This question needs a more careful answer than either “yes” or “no”.
What is established
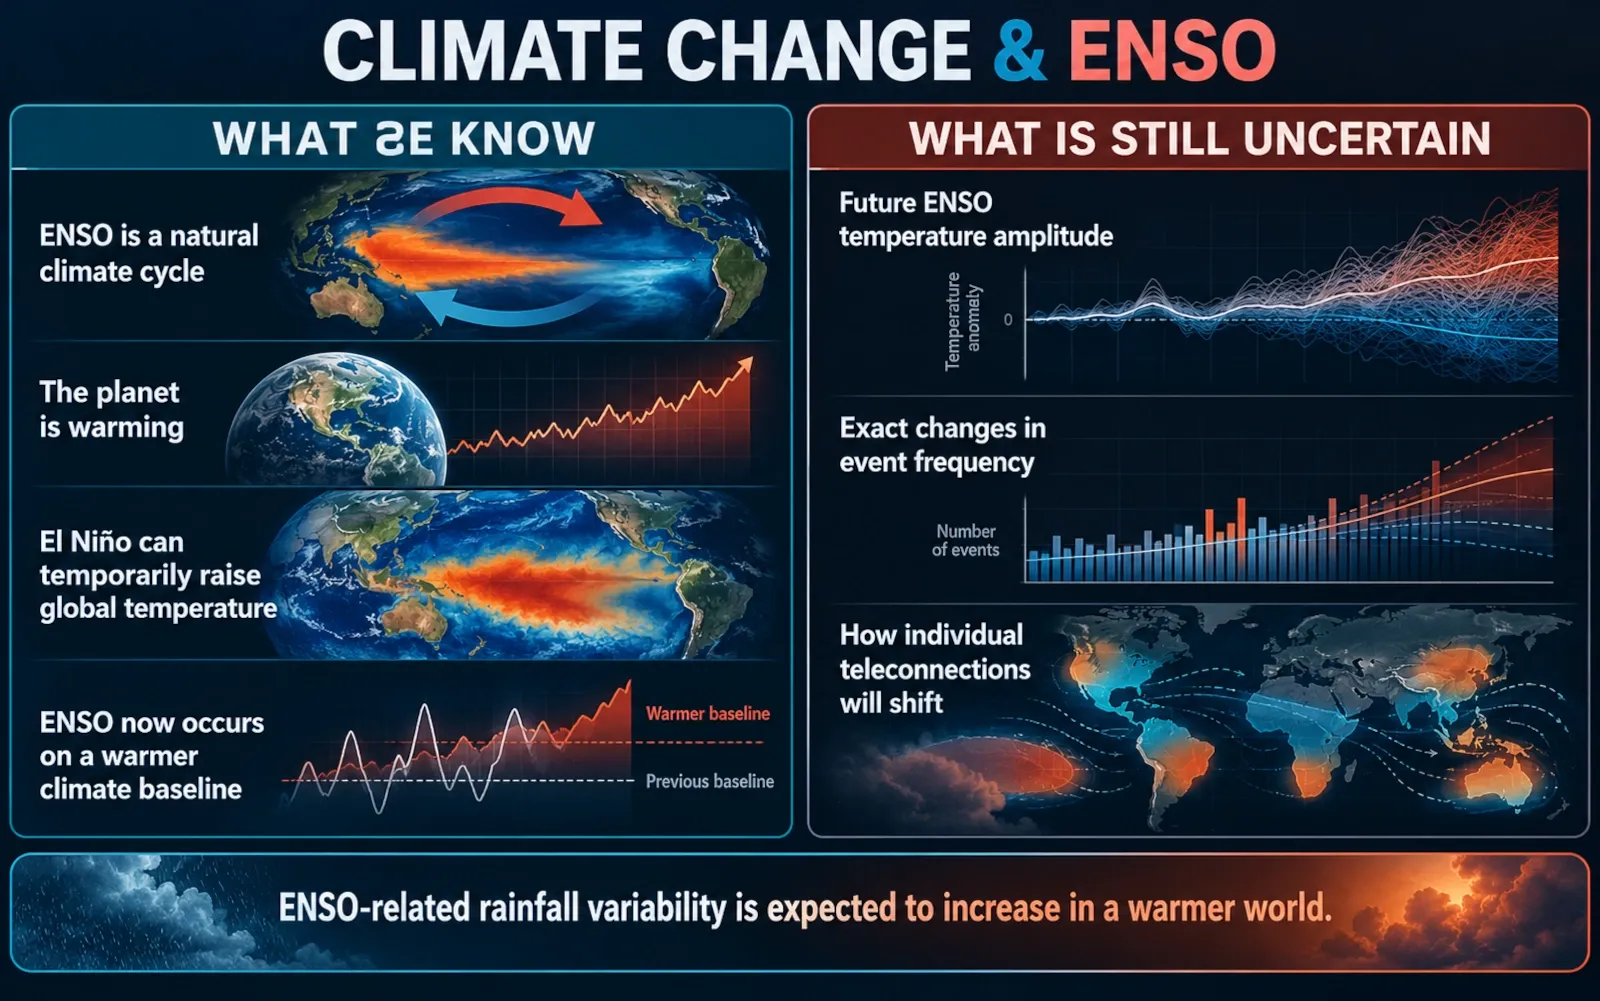
ENSO is a natural climate phenomenon.
El Niño and La Niña existed long before modern industrial greenhouse-gas emissions. Their existence is not evidence for or against human-caused climate change.
Human-caused global warming is raising the climate baseline.
An El Niño now occurs in a warmer world than an El Niño a century ago. That matters because an ENSO-driven heat or rainfall anomaly is superimposed on a changed background climate.
El Niño can temporarily raise global average surface temperature.
During El Niño, heat stored in the tropical Pacific is more readily released to the atmosphere. La Niña tends to produce the opposite short-term influence.
This natural fluctuation sits on top of the long-term warming trend.
What is still uncertain
The harder question is whether greenhouse warming will make the oceanic strength, frequency or exact spatial pattern of El Niño itself systematically larger.
The IPCC’s Sixth Assessment Report concludes that:
- ENSO will remain the dominant mode of year-to-year climate variability in a warmer world;
- there is no robust model consensus for a systematic change in ENSO sea-surface-temperature amplitude over the twenty-first century;
- ENSO-related rainfall variability is very likely to increase significantly later this century under moderate-to-high greenhouse-gas scenarios;
- some teleconnection patterns may shift as the background climate changes.
So the scientifically defensible summary is:
Climate change does not create El Niño, but it changes the climate in which El Niño operates. The future of ENSO’s ocean-temperature amplitude remains uncertain, while stronger ENSO-related rainfall variability is a more robust projection.
Current ENSO status and the 2026–2027 outlook
Current-outlook box — reviewed 16 October 2026. This section is time-sensitive.
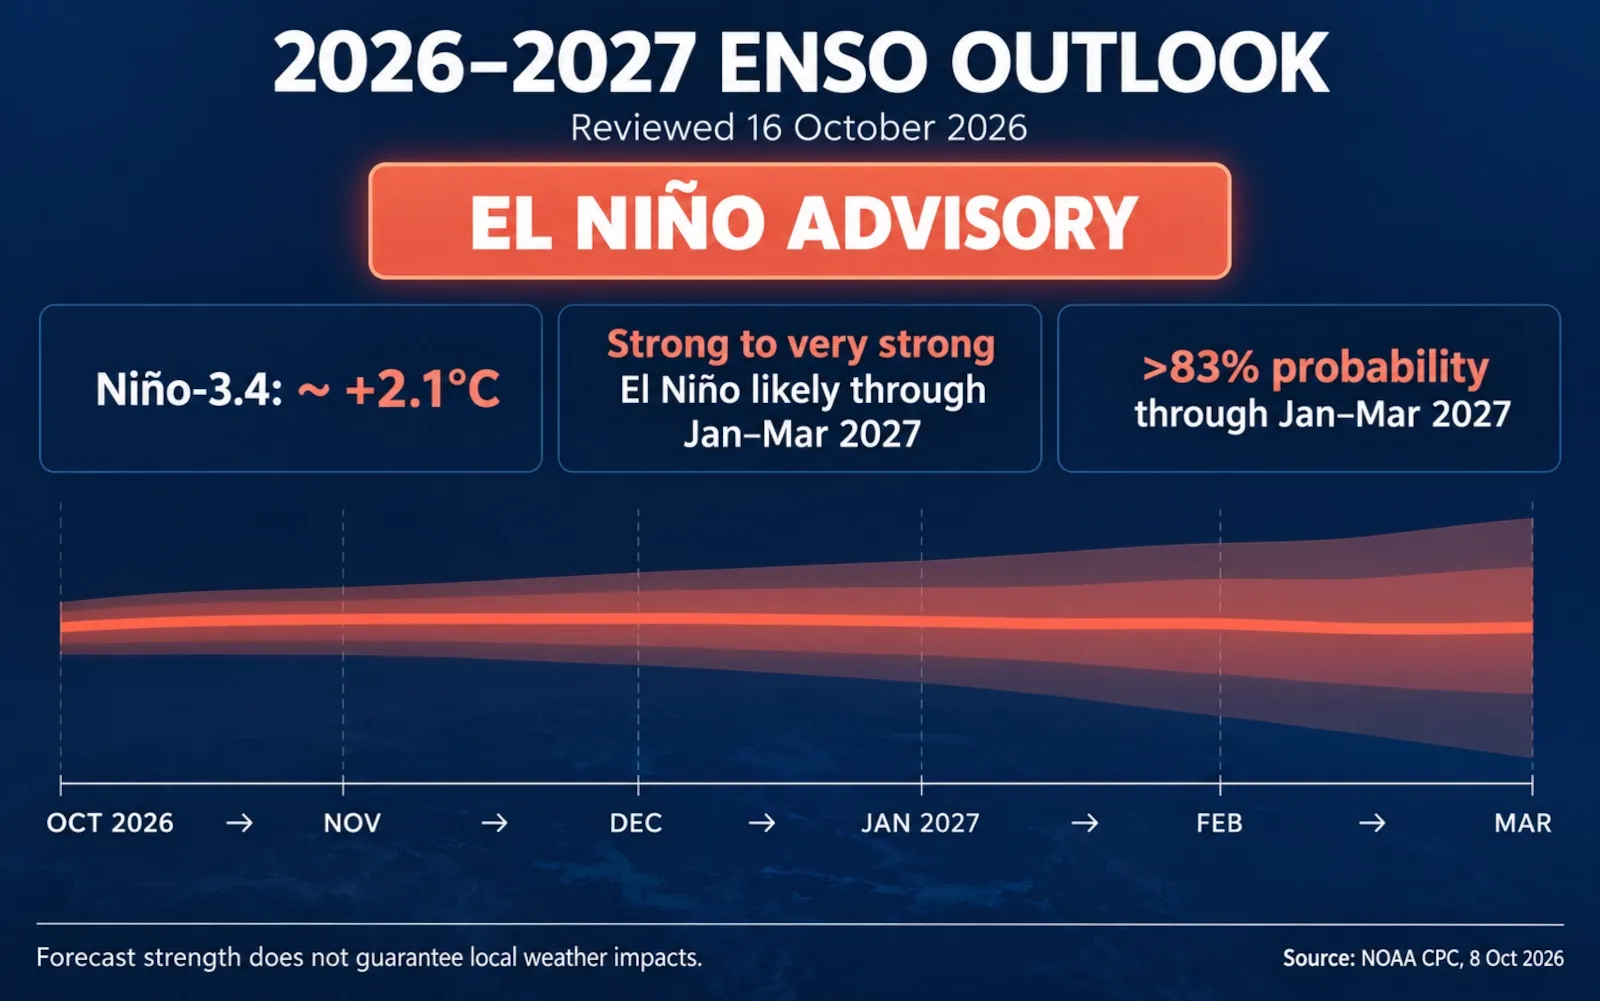
As of the latest NOAA Climate Prediction Center discussion issued 8 October 2026, an El Niño Advisory is in effect and El Niño is continuing to strengthen.
NOAA reported:
- a Niño-3.4 index of about +2.1°C in the latest monthly assessment;
- a strong-to-very-strong El Niño likely through January–March 2027;
- greater than an 83% chance of strong-to-very-strong conditions persisting through that period in the diagnostic synopsis.
NOAA’s October 2026 strength-probability product places the 2026 event firmly in the very strong category for the late-2026 seasonal windows.
The World Meteorological Organization’s October–November–December 2026 seasonal update also indicates further intensification of El Niño toward the end of 2026.
Does that mean a “Super El Niño” is happening?
If “Super El Niño” is being used informally to mean an exceptionally strong event, the current 2026 event is clearly in the range that attracts that label.
For technical writing, however, “very strong El Niño” is the more precise wording because it maps to an operational strength category.
Does this tell us exactly what winter 2026–2027 will look like?
No.
A very strong El Niño increases confidence in some broad seasonal patterns, but it still does not guarantee that every region will receive the canonical El Niño outcome.
For location-specific planning, use the latest seasonal outlook from your national meteorological service.
Will 2027 be the hottest year ever?
ENSO can affect global-average temperature, and a strong El Niño can provide a temporary warming influence.
But an annual global temperature ranking depends on many factors and should not be declared from ENSO strength alone. Any claim that “2027 will definitely be the hottest year” should be treated as a forecast claim requiring a dedicated, current global-temperature assessment — not as an automatic consequence of El Niño.
How reliable are El Niño forecasts?
ENSO is one of the more predictable large-scale climate patterns, but “predictable” does not mean certain.
Forecast teams combine:
- sea-surface temperature observations;
- subsurface ocean heat content;
- trade winds;
- atmospheric pressure;
- tropical rainfall and convection;
- satellites;
- ocean buoys;
- climate-model ensembles;
- expert interpretation.
An ensemble is especially important. Instead of trusting one model run, forecasters examine many simulations with slightly different initial conditions or model systems.
If most simulations converge on one outcome, confidence is higher. If they spread widely, uncertainty is larger.
Why forecasts improve as an event develops
Once the tropical ocean and atmosphere are clearly coupled in an El Niño state, forecasters can observe the event directly rather than relying only on early precursors.
That still does not eliminate regional uncertainty.
A forecast can have high confidence that El Niño will be very strong while having lower confidence about whether one specific city will have a wet winter.
Those are different forecast questions.
Forecast probability is not failure to know
If a seasonal outlook says a region has an elevated chance of above-average rainfall, that does not mean forecasters are “wrong” if the season ultimately lands near average.
Probabilistic forecasts describe risk across many possible outcomes. They should be judged by calibration over many forecasts, not by whether one deterministic-sounding headline came true.
How long does El Niño last and how often does it happen?
ENSO does not operate on a fixed clock.
El Niño and La Niña recur irregularly, typically every two to seven years when viewed as part of the ENSO cycle.
Many El Niño events:
- develop during Northern Hemisphere spring or summer;
- strengthen through autumn;
- peak near Northern Hemisphere winter;
- weaken during the following spring.
An event can last around a year and sometimes longer.
La Niña can also persist across multiple winters; so-called multi-year or “triple-dip” La Niña periods have occurred.
The neutral phase between events can last for months or longer.
What should people do when a strong El Niño is forecast?
ENSO itself is not an emergency warning.
It is an early indicator that certain seasonal hazards may become more or less likely.
The practical response is therefore local preparedness, not global panic.
If your region has increased flood or heavy-rain risk
- Follow your national and local weather services.
- Know whether your home or workplace is in a flood or landslide-prone area.
- Learn evacuation routes before severe weather arrives.
- Keep a basic emergency kit.
- Never drive through floodwater.
- Review insurance and important documents before the wet season.
If your region has increased drought or wildfire risk
- Follow water-use restrictions.
- Monitor wildfire warnings and air-quality guidance.
- Prepare for heat and smoke if you are in a vulnerable group.
- Keep vegetation and flammable material managed where local guidance recommends it.
- Follow agricultural and water-management advice specific to your region.
If you work in agriculture, fisheries or logistics
General ENSO information is not enough for operational decisions.
Use:
- regional seasonal forecasts;
- soil-moisture and drought products;
- reservoir data;
- ocean and fisheries advisories;
- commodity-specific information;
- local risk-management plans.
The best time to prepare for an extreme event is before the extreme event is happening.
Common mistakes
Mistake 1: “El Niño means bad weather everywhere”
It does not.
El Niño redistributes climate risk. One region can face drought while another becomes wetter. Some areas may experience little consistent ENSO signal at all.
Mistake 2: “La Niña is simply the exact opposite”
The Pacific-ocean state is broadly opposite, but impacts are not perfectly symmetrical.
Mistake 3: “A very strong El Niño guarantees extreme weather”
Strength raises the odds of some expected patterns. It does not guarantee them.
Mistake 4: “One hot patch of Pacific water means El Niño”
ENSO classification requires persistence and an atmospheric response, not just one temperature measurement.
Mistake 5: “Every flood, drought or storm during El Niño was caused by El Niño”
Attribution is more complicated. ENSO changes background probabilities, while individual events also depend on local weather dynamics and other climate influences.
Mistake 6: “El Niño proves climate change”
ENSO is natural variability. Human-caused climate change is established from a much larger body of evidence. The two interact, but they are not the same phenomenon.
Mistake 7: “Super El Niño is a new phase beyond El Niño”
It is not. It is an informal label for an exceptionally strong El Niño.
Mistake 8: “If a model gives one number, that is the future”
Seasonal climate forecasts are probabilistic. A single model output is not the same as an official multi-model expert outlook.
Security, privacy and safety notes
This is a science explainer, not a local emergency forecast.
For decisions involving floods, tropical cyclones, wildfire, extreme heat, landslides, drought or evacuation:
- use official warnings from your national and local authorities;
- do not rely on social-media graphics with no source or issue date;
- check the date of ENSO maps and forecasts before sharing them;
- distinguish between an ENSO outlook and a weather warning;
- treat exact local-impact claims months in advance with caution.
Scientific uncertainty is not a reason to ignore risk. It is information about the range of plausible outcomes.
Faster alternative
If you only want the essentials, remember this five-line version:
- ENSO is a natural tropical-Pacific ocean–atmosphere cycle.
- El Niño = warmer central/eastern equatorial Pacific + weaker trade winds + eastward-shifted tropical rainfall.
- La Niña = cooler central/eastern equatorial Pacific + stronger trade winds + stronger eastern-Pacific upwelling.
- “Super El Niño” is an informal name for a very strong El Niño, not a separate phase.
- ENSO changes the probability of seasonal weather patterns; it does not predict tomorrow’s weather.
For the live status, go directly to the latest NOAA Climate Prediction Center ENSO Diagnostic Discussion and your country’s seasonal outlook.
FAQ
What does El Niño mean in simple terms?
El Niño is a recurring warming of the central and eastern tropical Pacific that develops together with changes in trade winds, tropical rainfall and atmospheric pressure. Those changes can alter seasonal weather patterns far beyond the Pacific.
What is the difference between El Niño and La Niña?
El Niño is ENSO’s warm phase; La Niña is its cool phase. During El Niño the central/eastern tropical Pacific is warmer than average and trade winds usually weaken. During La Niña that region is cooler and trade winds usually strengthen.
Are we in El Niño or La Niña right now?
As of 16 October 2026, NOAA has an El Niño Advisory in effect. The event is strong and continuing to intensify toward the 2026–2027 Northern Hemisphere winter.
Is 2026 an El Niño year?
Yes. NOAA reported that El Niño conditions developed in 2026 after the tropical Pacific transitioned out of the preceding La Niña and through a neutral phase.
Is a Super El Niño expected in 2026 or 2027?
The 2026 El Niño is in NOAA’s very strong range in late 2026. “Super El Niño” is an informal label, so the more precise wording is that a very strong El Niño is occurring and is expected to persist into early 2027 according to the October 2026 NOAA outlook.
How rare is a Super El Niño?
Exceptionally strong El Niño events are uncommon. Famous modern examples include 1982–83, 1997–98 and 2015–16. Exact rankings depend on the index, dataset and uncertainty, especially for nineteenth-century events.
When was the last El Niño before 2026?
Before the current 2026 event, the previous major El Niño occurred in 2023–2024.
How long will the current El Niño last?
NOAA’s 8 October 2026 outlook says strong-to-very-strong El Niño conditions are likely through January–March 2027, after which forecast probabilities gradually shift toward weaker El Niño and eventually neutral conditions. The exact transition timing remains uncertain.
Does El Niño mean more rain?
Only in some regions and seasons. El Niño redistributes rainfall, making some places wetter and others drier.
Which is better for rain, El Niño or La Niña?
Neither is universally “better for rain”. The answer depends on location and season. A phase that increases rainfall in one region can increase drought risk elsewhere.
Does El Niño mean more snow?
Not globally. In some regions an El Niño storm track can deliver more moisture, which can produce more snow if temperatures are cold enough. In warmer areas the same moisture may fall as rain.
Does El Niño make the whole planet hotter?
El Niño often gives global-average surface temperature a temporary upward push because heat is released from the tropical Pacific into the atmosphere. It does not make every region hotter at the same time.
Which is colder, La Niña or El Niño?
La Niña is the cooler ENSO phase in the central and eastern tropical Pacific. It also tends to exert a temporary cooling influence on global-average surface temperature relative to El Niño.
Which is worse for Atlantic hurricanes, El Niño or La Niña?
La Niña is generally more favourable for Atlantic hurricane activity because it tends to reduce vertical wind shear. El Niño usually increases Atlantic wind shear and suppresses hurricane activity. Other climate factors can still override or modify that tendency.
What country is most affected by El Niño?
There is no single answer. Peru and Ecuador are close to the oceanic centre of El Niño and can experience major coastal and marine impacts, while Indonesia, Australia, parts of Africa, South Asia, Central America and North America can also experience strong effects. The most affected location changes from one event to another.
What are the benefits of El Niño?
El Niño can bring needed rain to some drought-affected areas and can suppress Atlantic hurricane activity. But the same event may create damaging floods, droughts or ecological disruption elsewhere. “Benefit” is therefore region-specific.
Does climate change cause El Niño?
No. ENSO is a natural phenomenon that existed before modern industrial warming. Climate change alters the background climate and is expected to change some ENSO-related impacts, especially rainfall variability, but the future change in ENSO sea-surface-temperature amplitude remains uncertain.
Can scientists predict exactly what a Super El Niño will do?
No. Scientists can forecast the probability and likely strength of ENSO and estimate broad seasonal tendencies. They cannot use ENSO alone to predict exact storms, rainfall totals or local disasters months in advance.
Last tested
Tested against:
- NOAA Climate Prediction Center — ENSO Diagnostic Discussion, issued 8 October 2026
- NOAA CPC — ENSO Strength Probabilities, October 2026
- World Meteorological Organization — Global Seasonal Climate Update for October–November–December 2026
- NOAA Climate.gov / NOAA ENSO educational resources
- IPCC AR6 Working Group I, Chapter 4
- Peer-reviewed ENSO economic-impact and historical-reconstruction research
Last tested: 2026-10-16
Related guides
Carefully selected guides to help you understand the topic and complete the next useful step.